CloudWatch Log Analytics
CloudWatch Log Analytics enables you to interactively search and analyze your log data in CloudWatch Logs. You can perform queries to help you more efficiently and effectively respond to operational issues. If an issue occurs, you can use Log Analytics to identify potential causes and validate deployed fixes. It includes a purpose-built query language with a few simple but powerful commands.
Log Analytics is the CloudWatch console experience that combines the Logs Insights query editor, Live Tail, and Contributor Insights into a single interface, and is now the default. If you previously used the standalone Logs Insights page, the query editor and query syntax are the same, they are now surfaced under Log Analytics.
In this lab exercise, we'll take a look at an example of using Log Analytics to query the EKS control plane logs. First navigate to Log Analytics in the console:
 Open CloudWatch console
You will be presented with a screen that looks like this:
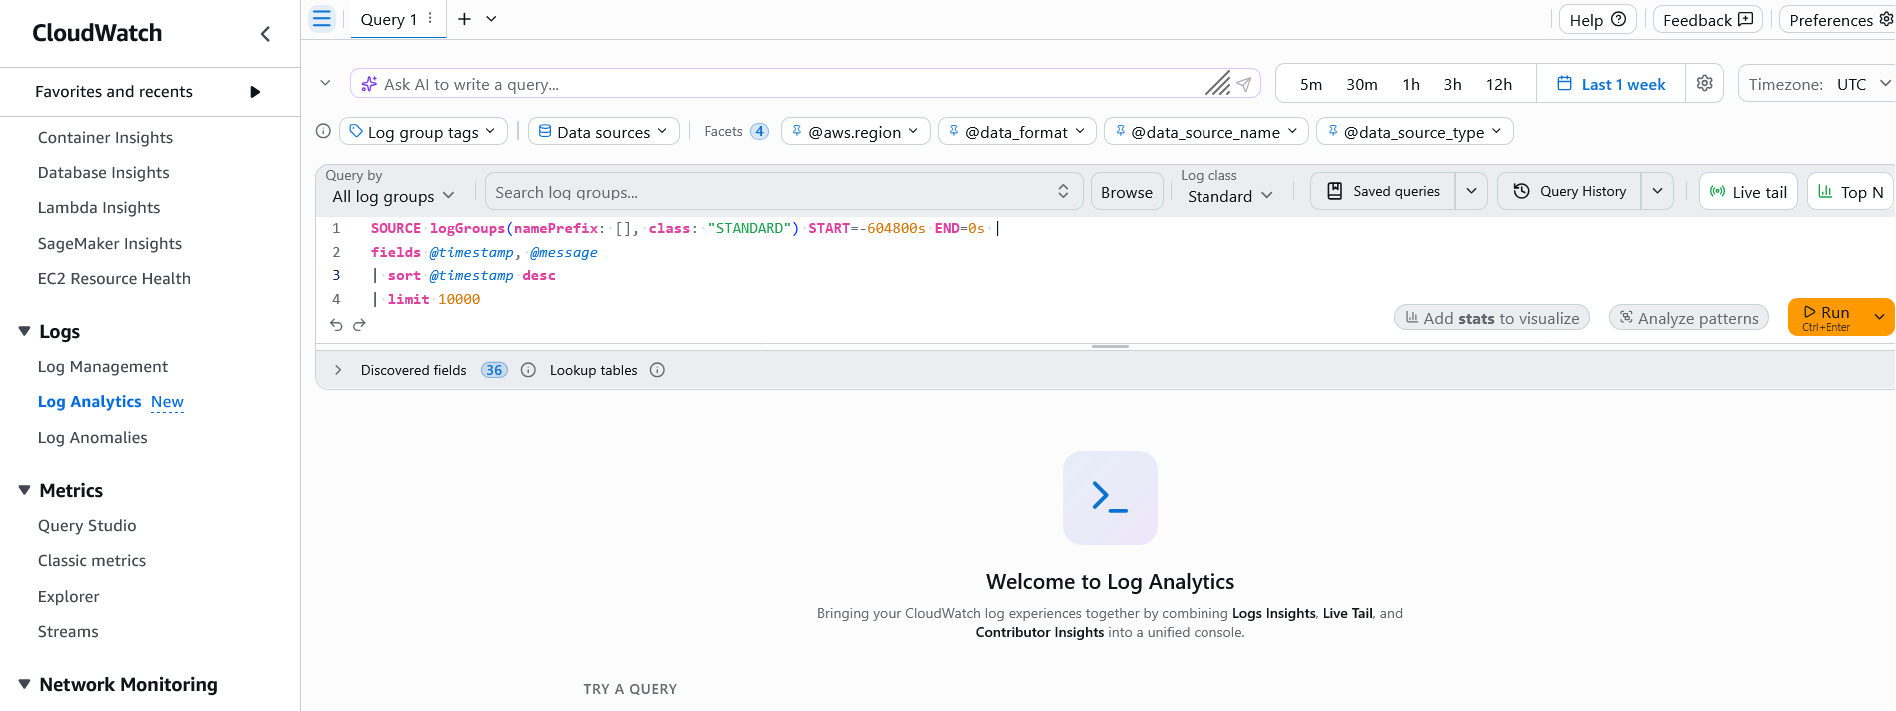
A common use-case for Log Analytics is to identify component within an EKS cluster that are making a high volume of requests to the Kubernetes API server. One way to do this is with the following query:
fields userAgent, requestURI, @timestamp, @message
| filter @logStream ~= "kube-apiserver-audit"
| stats count(userAgent) as count by userAgent
| sort count desc
This query checks the Kubernetes audit logs and counts the number of API requests made grouped by userAgent and sorted them in descending order. In the Log Analytics console select the log group for your EKS cluster:
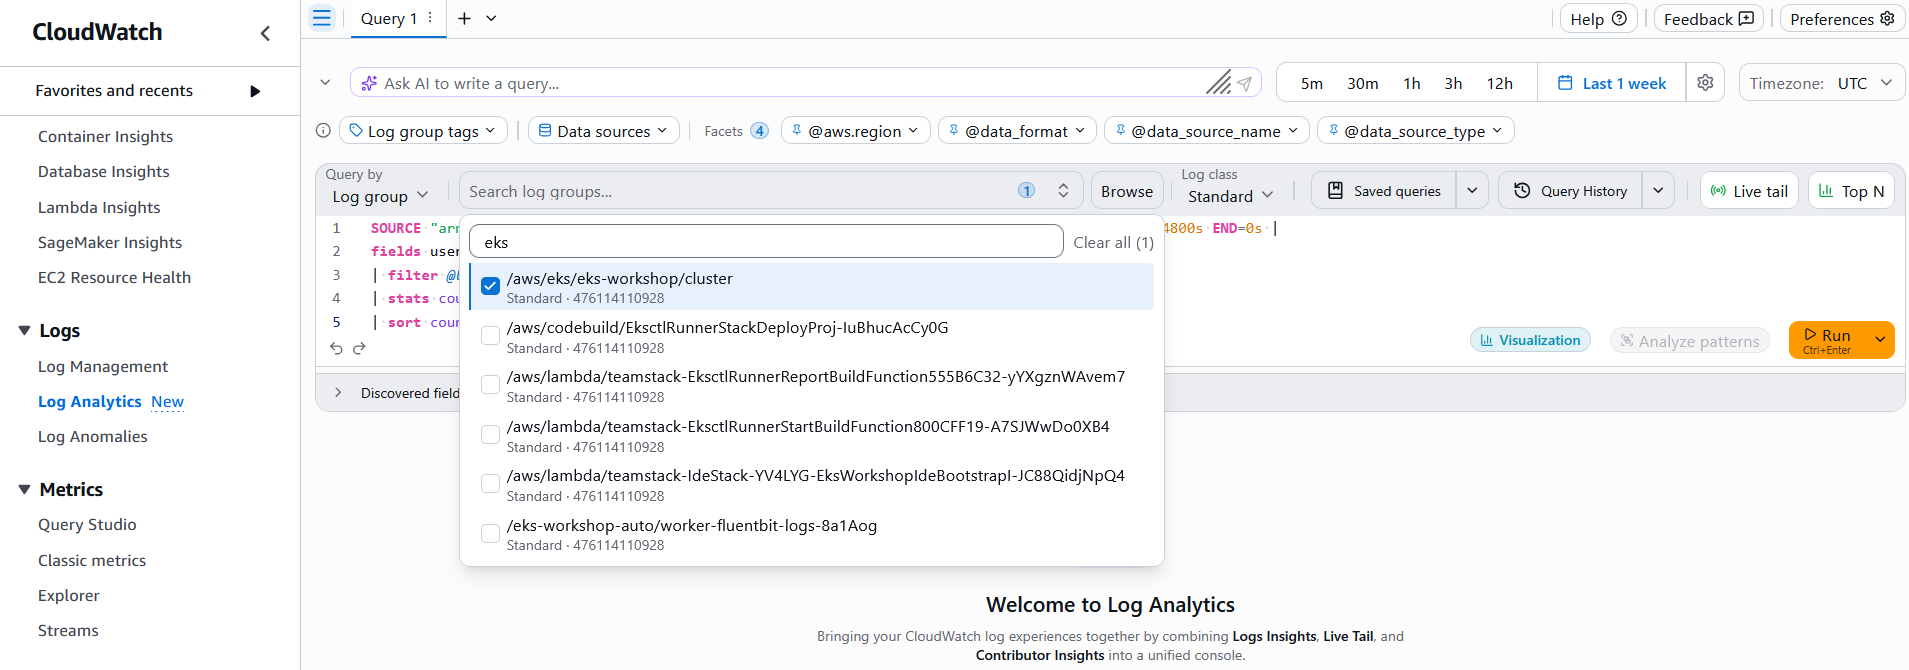
Copy the query to the console and press Run query, which will return results:
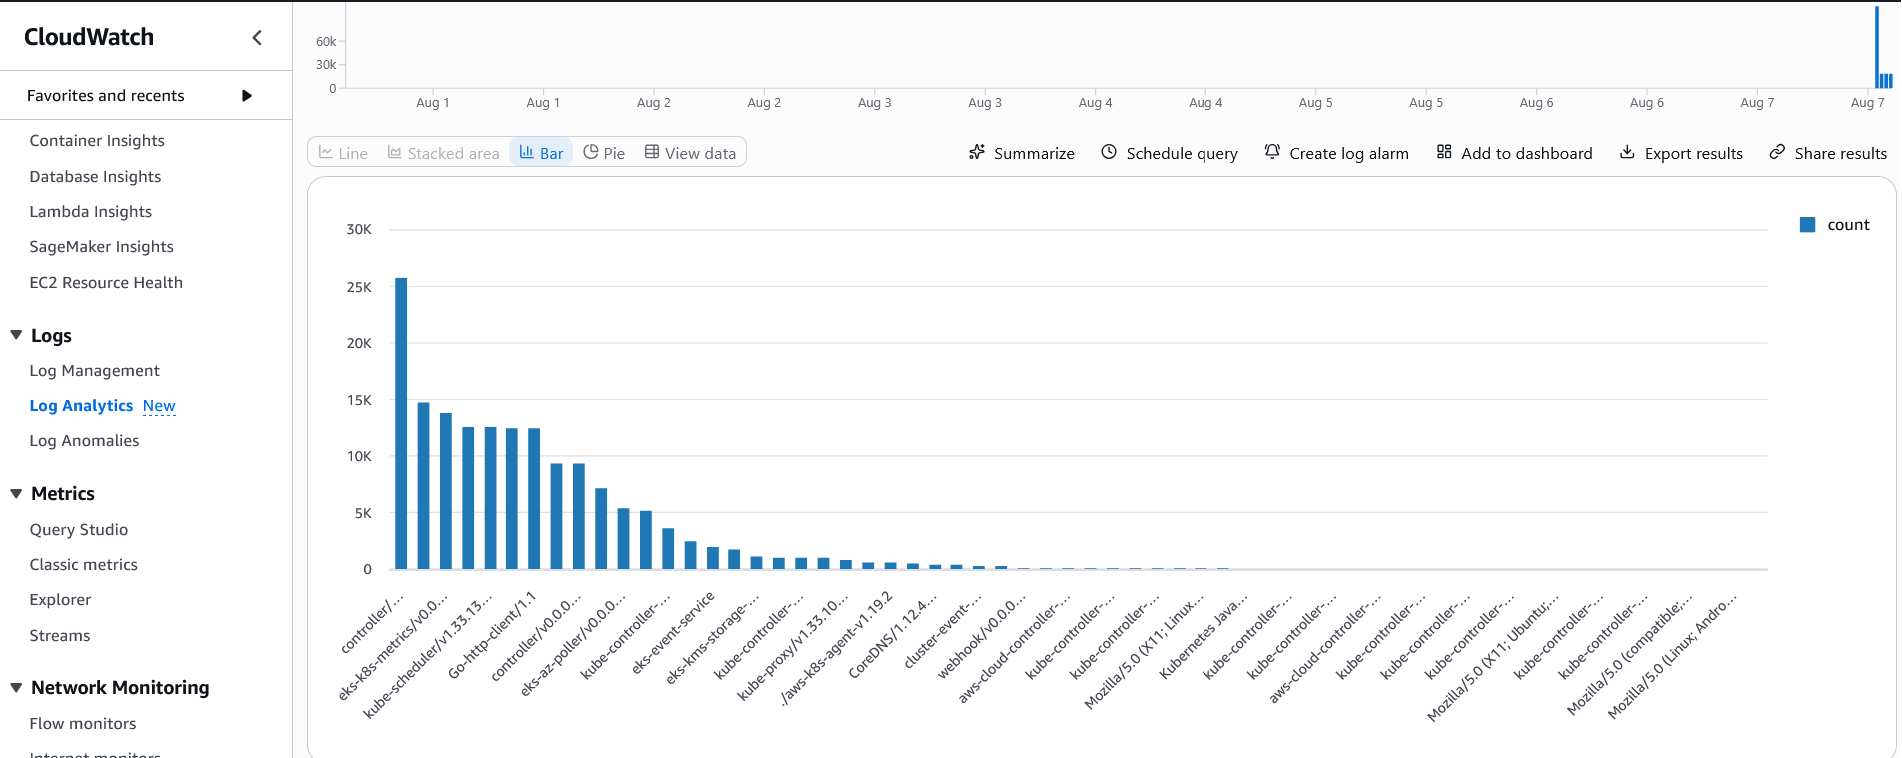
This information can be invaluable to understand what components are sending requests to the API server.
If you are using the CDK Observability Accelerator then check out the CloudWatch Insights Add-on which collects, aggregates, and summarizes metrics and logs from your containerized applications and microservices in EKS.