Accessing Grafana
An instance of Grafana has been pre-installed in your EKS cluster. To access it you first need to retrieve the URL:
~$kubectl get ingress -n grafana grafana -o=jsonpath='{.status.loadBalancer.ingress[0].hostname}{"\n"}'
k8s-grafana-grafana-123497e39be-2107151316.us-west-2.elb.amazonaws.com
Opening this URL in a browser will bring up a login screen.

To retrieve the credentials for the user query the secret created by the Grafana helm chart:
~$kubectl get -n grafana secrets/grafana -o=jsonpath='{.data.admin-user}' | base64 -d; printf "\n"
~$kubectl get -n grafana secrets/grafana -o=jsonpath='{.data.admin-password}' | base64 -d; printf "\n"
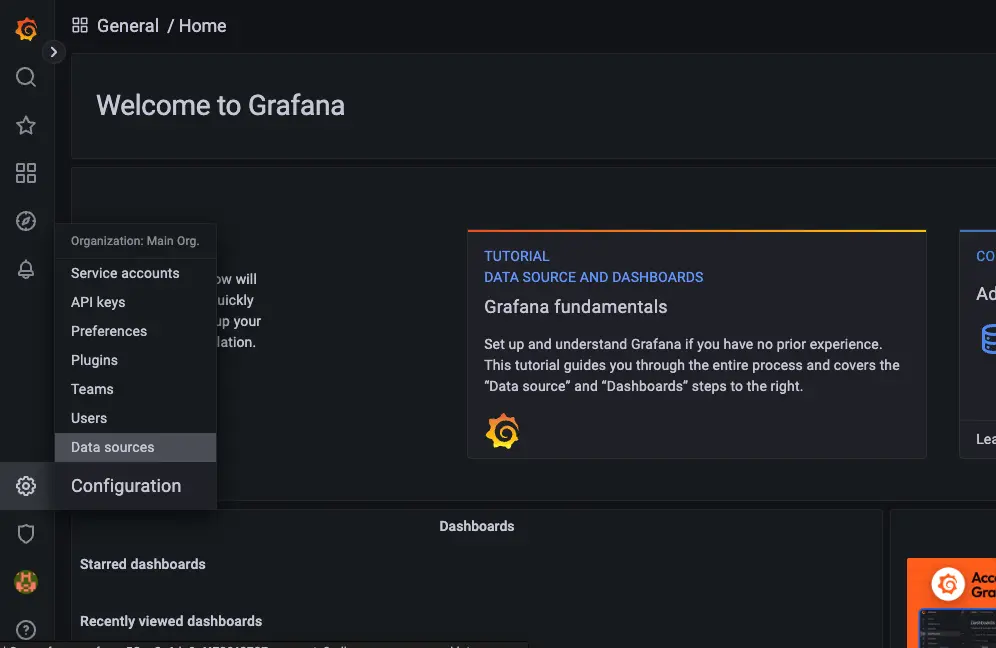
After logging into the Grafana console, let's take a look at the datasources section. You should see the Amazon Managed Service for Prometheus workspace configured as a datasource already.